Fullerton Securities' Daily Market Newsletter : 29th September 2010
•
0 likes•1 view


Recommended
Recommended
More Related Content
What's hot
What's hot (20)
Similar to Fullerton Securities' Daily Market Newsletter : 29th September 2010
Similar to Fullerton Securities' Daily Market Newsletter : 29th September 2010 (20)
More from Fullerton Securities
More from Fullerton Securities (20)
Fullerton Securities' Daily Market Newsletter : 29th September 2010
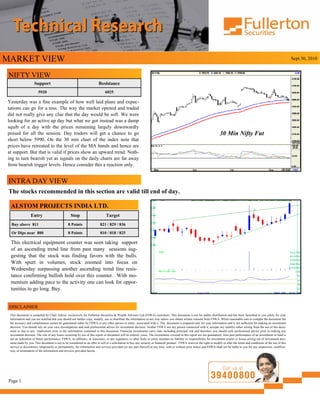
- 1. MARKET VIEW Sept 30, 2010 NIFTY VIEW Support Resistance 5920 6025 Yesterday was a fine example of how well laid plans and expec- tations can go for a toss. The way the market opened and traded did not really give any clue that the day would be soft. We were looking for an active up day but what we got instead was a damp squib of a day with the prices remaining largely downwardly poised for all the session. Day traders will get a chance to go 30 Min Nifty Fut short below 5990. On the 30 min chart of the index note that prices have retreated to the level of the MA bands and hence are at support. But that is valid if prices show an upward trend. Noth- ing to turn bearish yet as signals on the daily charts are far away from bearish trigger levels. Hence consider this a reaction only. INTRA DAY VIEW The stocks recommended in this section are valid till end of day. ALSTOM PROJECTS INDIA LTD. Entry Stop Target Buy above 811 8 Points 821 / 829 / 836 Or Dips near 800 8 Points 810 / 818 / 825 This electrical equipment counter was seen taking support of an ascending trend line from past many sessions sug- gesting that the stock was finding favors with the bulls. With spurt in volumes, stock zoomed into focus on Wednesday surpassing another ascending trend line resis- tance confirming bullish hold over this counter. With mo- mentum adding pace to the activity one can look for oppor- tunities to go long. Buy. DISCLAIMER This document is compiled by Chart Advise exclusively for Fullerton Securities & Wealth Advisors Ltd (FSWA) customers. This document is not for public distribution and has been furnished to you solely for your information and you are notified that you should not further copy, modify, use or distribute the information in any way unless you obtain written consent from FSWA. While reasonable care to compile the document but the accuracy and completeness cannot be guaranteed either by FSWA or any other person or entity associated with it. The document is prepared only for your information and is not sufficient for making an investment decision. You should rely on your own investigations and seek professional advice for investment decision. Neither FSWA nor any person connected with it, accepts any liability either arising from the use of this docu- ment or due to any inadvertent error in the information contained in this document. Financial investments carry risks including principal risk and therefore you should seek professional advice prior to making any investment decision. The risk of any losses occurring by use of this report or document will be entirely yours. The investments covered in this report are not guaranteed. Also past performance of an investment or fund is not an indication of future performance. FSWA, its affiliates, or associates, or any regulatory or other body or entity assumes no liability or responsibility for investment results or losses arising out of investment deci- sions made by you. This document is not to be considered as an offer to sell or a solicitation to buy any security or financial product. FSWA reserves the right to modify or alter the terms and conditions of the use of this service or discontinue, temporarily or permanently, the information and services provided (or any part thereof) at any time, with or without prior notice and FSWA shall not be liable to you for any suspension, modifica- tion, or termination of the information and services provided herein. Page 1
- 2. TATA MOTORS LTD. Entry Stop Target Buy above 1107 11 Points 1121 / 1132 Or Dips near 1096 11 Points 1110 / 1121 Auto was the only sector that ended in green on Wednesday with this counter also displaying signs of bullishness. An ascending trend line that was acting as resistance was sur- passed on back of buying activity suggesting further ad- vances today. Momentum that was in positive zone has turned up afresh, signaling renewed vigor of the longs. Go for buy. HINDUSTAN PETROLEUM CORP. LTD. Entry Stop Target Sell below 520 5 Points 513.50 / 509 / 504 Or Rally around 525 5 Points 518.50 / 514 / 509 From appended daily chart we observe that this refinery counter is unable to surpass strong resistance of 547 level from past many sessions. Built on negative sentiment and on account of selling pressure bears dragged prices of this counter lower during previous session, breaching support of 20 DMA alerting weakness. Momentum too has taken a hit and is falling, alerting that bulls have been tired. Sell. DISCLAIMER This document is compiled by Chart Advise exclusively for Fullerton Securities & Wealth Advisors Ltd (FSWA) customers. This document is not for public distribution and has been furnished to you solely for your information and you are notified that you should not further copy, modify, use or distribute the information in any way unless you obtain written consent from FSWA. While reasonable care to compile the document but the accuracy and completeness cannot be guaranteed either by FSWA or any other person or entity associated with it. The document is prepared only for your information and is not sufficient for making an investment decision. You should rely on your own investigations and seek professional advice for investment decision. Neither FSWA nor any person connected with it, accepts any liability either arising from the use of this docu- ment or due to any inadvertent error in the information contained in this document. Financial investments carry risks including principal risk and therefore you should seek professional advice prior to making any investment decision. The risk of any losses occurring by use of this report or document will be entirely yours. The investments covered in this report are not guaranteed. Also past performance of an investment or fund is not an indication of future performance. FSWA, its affiliates, or associates, or any regulatory or other body or entity assumes no liability or responsibility for investment results or losses arising out of investment deci- sions made by you. This document is not to be considered as an offer to sell or a solicitation to buy any security or financial product. FSWA reserves the right to modify or alter the terms and conditions of the use of this service or discontinue, temporarily or permanently, the information and services provided (or any part thereof) at any time, with or without prior notice and FSWA shall not be liable to you for any suspension, modifica- tion, or termination of the information and services provided herein. Page 2
- 3. How to read this report Nifty View is a brief description of the Nifty futures stating what exactly happened during the previous trading ses- sion. The narration will also explain what is the current market sentiment and how it is having effect on the market scenario. It will also throw light on how we can expect the market to move for the day along with relevant support and resistance levels. A chart is also appended in order to provide more clarity to the write-up. Intra Day View will consist of 3 stocks from the actively traded counters of the NSE / BSE along with charts. The trades will be given along with three sets of information – Entry The ideal price at which you should trade (Buy / Sell) the particular counter - Buy above means Buy above the level mentioned - Buy on dips means Buy when prices dip towards the level mentioned - Buy around means Buy the counter near the range mentioned - Sell below means Sell below the levels mentioned - Sell on rallies means Sell when prices move higher towards the price mentioned - Sell around means Sell when prices move higher into the range mentioned Stop The level beyond which one should not be holding this counter in case the trade backfires. The stop loss is men- tioned in number of points. The stop has to be placed from the point placed from the point of entry around the level mentioned. Exit The suggested targets around which one may choose to book profits. Ideally more than one target is provided so that one can continue to be in the trade depending on ones risk appetite. DISCLAIMER This document is compiled by Chart Advise exclusively for Fullerton Securities & Wealth Advisors Ltd (FSWA) customers. This document is not for public distribution and has been furnished to you solely for your information and you are notified that you should not further copy, modify, use or distribute the information in any way unless you obtain written consent from FSWA. While reasonable care to compile the document but the accuracy and completeness cannot be guaranteed either by FSWA or any other person or entity associated with it. The document is prepared only for your information and is not sufficient for making an investment decision. You should rely on your own investigations and seek professional advice for investment decision. Neither FSWA nor any person connected with it, accepts any liability either arising from the use of this docu- ment or due to any inadvertent error in the information contained in this document. Financial investments carry risks including principal risk and therefore you should seek professional advice prior to making any investment decision. The risk of any losses occurring by use of this report or document will be entirely yours. The investments covered in this report are not guaranteed. Also past performance of an investment or fund is not an indication of future performance. FSWA, its affiliates, or associates, or any regulatory or other body or entity assumes no liability or responsibility for investment results or losses arising out of investment deci- sions made by you. This document is not to be considered as an offer to sell or a solicitation to buy any security or financial product. FSWA reserves the right to modify or alter the terms and conditions of the use of this service or discontinue, temporarily or permanently, the information and services provided (or any part thereof) at any time, with or without prior notice and FSWA shall not be liable to you for any suspension, modifica- tion, or termination of the information and services provided herein. Page 3
- 4. NIFTY DAY TRADING TABLE SCRIPT SECOND FIRST CLOSE FIRST SECOND PIVOT SUPPORT SUPPORT RESISTANCE RESISTANCE ABB 903 921 939.1 967 994 949 ACC 981 993 1005.15 1028 1050 1016 AMBUJACEM 145 146 147.15 148 149 147 AXISBANK 1422 1466 1510.4 1538 1566 1494 BHARTIARTL 353 358 363.4 373 382 367 BHEL 2442 2460 2477.4 2505 2532 2487 BPCL 743 754 765.15 781 797 770 CAIRN 326 328 330.5 334 338 332 CIPLA 311 314 317.1 321 325 318 DLF 364 368 372.95 381 390 377 GAIL 463 469 474.65 482 489 476 GRASIM 2169 2190 2210.55 2230 2250 2210 HCLTECH 410 413 417.2 421 425 417 HDFC 688 697 707 718 730 709 HDFCBANK 2400 2421 2442.85 2469 2495 2448 HEROHONDA 1839 1852 1865.1 1878 1891 1865 HINDALCO 185 188 191.55 197 202 193 HINDUNILVR 300 303 306 309 312 306 ICICIBANK 1084 1093 1101.95 1114 1126 1105 IDEA 72 73 73.95 75 77 74 INFOSYSTCH 2961 2996 3031.05 3073 3114 3038 ITC 168 171 173.6 178 183 176 JINDALSTEL 697 702 706.15 713 719 708 LT 2014 2027 2040.3 2055 2069 2041 M&M 681 690 698.75 714 729 705 MARUTI 1389 1410 1430.05 1466 1502 1446 NATIONALUM 398 402 405 410 414 406 NTPC 213 215 217 220 223 218 ONGC 1384 1403 1421.35 1454 1486 1435 PNB 1277 1287 1297.35 1311 1325 1301 POWERGRID 105 107 108.65 110 112 109 RANBAXY 542 549 556 565 575 558 RCOM 167 168 169.9 172 174 170 RELCAPITAL 774 785 796.15 814 833 803 RELIANCE 987 993 999 1007 1015 1001 RELINFRA 1053 1069 1084.5 1112 1140 1096 RPOWER 158 160 161.2 164 167 162 DISCLAIMER This document is compiled by Chart Advise exclusively for Fullerton Securities & Wealth Advisors Ltd (FSWA) customers. This document is not for public distribution and has been furnished to you solely for your information and you are notified that you should not further copy, modify, use or distribute the information in any way unless you obtain written consent from FSWA. While reasonable care to compile the document but the accuracy and completeness cannot be guaranteed either by FSWA or any other person or entity associated with it. The document is prepared only for your information and is not sufficient for making an investment decision. You should rely on your own investigations and seek professional advice for investment decision. Neither FSWA nor any person connected with it, accepts any liability either arising from the use of this docu- ment or due to any inadvertent error in the information contained in this document. Financial investments carry risks including principal risk and therefore you should seek professional advice prior to making any investment decision. The risk of any losses occurring by use of this report or document will be entirely yours. The investments covered in this report are not guaranteed. Also past performance of an investment or fund is not an indication of future performance. FSWA, its affiliates, or associates, or any regulatory or other body or entity assumes no liability or responsibility for investment results or losses arising out of investment deci- sions made by you. This document is not to be considered as an offer to sell or a solicitation to buy any security or financial product. FSWA reserves the right to modify or alter the terms and conditions of the use of this service or discontinue, temporarily or permanently, the information and services provided (or any part thereof) at any time, with or without prior notice and FSWA shall not be liable to you for any suspension, modifica- tion, or termination of the information and services provided herein. Page 4
- 5. NIFTY DAY TRADING TABLE continued SCRIPT SECOND FIRST CLOSE FIRST SECOND PIVOT SUPPORT SUPPORT RESISTANCE RESISTANCE SAIL 201 203 204.85 207 210 205 SBIN 3164 3180 3195.7 3218 3241 3202 SIEMENS 799 810 821.6 840 858 828 STER 154 158 161.4 167 174 164 SUNPHARMA 1957 1979 2000.65 2019 2037 1997 SUZLON 51 52 52.75 54 55 53 TATACOMM 304 309 313 320 326 315 TATAMOTORS 1070 1088 1106.45 1117 1128 1099 TATAPOWER 1326 1338 1351.25 1366 1381 1353 TATASTEEL 642 647 653.1 662 671 656 TCS 902 911 920.35 933 947 924 UNITECH 86 87 87.8 89 90 88 WIPRO 431 437 442.35 449 456 443 SENSEX 19727 19842 19956.34 20153 20349 20038 NIFTY 5922 5957 5991.30 6049 6106 6014 HOW TO READ THE TRADING TABLE 1. If prices are above the LAST CLOSE column, then look to BUY the SCRIP 2. If prices are below the LAST CLOSE column, then look to SELL the SCRIP. 3. The PIVOT is to be used as an addition reference of the trend along with the last close. 4. If prices are weak then look to BUY AROUND the FIRST SUPPORT column. 5. On long positions, the STOPLOSS is given in the left most column. 6. If holding long positions, then take partial profits around the FIRST RESISTANCE column. 7. Profit in Long positions can be taken and one can exit around the SECOND RESISTANCE column. 8. If holding short positions, then the SECOND RESISTANCE column should be used as a stoploss. DISCLAIMER This document is compiled by Chart Advise exclusively for Fullerton Securities & Wealth Advisors Ltd (FSWA) customers. This document is not for public distribution and has been furnished to you solely for your information and you are notified that you should not further copy, modify, use or distribute the information in any way unless you obtain written consent from FSWA. While reasonable care to compile the document but the accuracy and completeness cannot be guaranteed either by FSWA or any other person or entity associated with it. The document is prepared only for your information and is not sufficient for making an investment decision. You should rely on your own investigations and seek professional advice for investment decision. Neither FSWA nor any person connected with it, accepts any liability either arising from the use of this docu- ment or due to any inadvertent error in the information contained in this document. Financial investments carry risks including principal risk and therefore you should seek professional advice prior to making any investment decision. The risk of any losses occurring by use of this report or document will be entirely yours. The investments covered in this report are not guaranteed. Also past performance of an investment or fund is not an indication of future performance. FSWA, its affiliates, or associates, or any regulatory or other body or entity assumes no liability or responsibility for investment results or losses arising out of investment deci- sions made by you. This document is not to be considered as an offer to sell or a solicitation to buy any security or financial product. FSWA reserves the right to modify or alter the terms and conditions of the use of this service or discontinue, temporarily or permanently, the information and services provided (or any part thereof) at any time, with or without prior notice and FSWA shall not be liable to you for any suspension, modifica- tion, or termination of the information and services provided herein. Page 5